Wednesday, March 16, 2016

Day 7 Notes Superposition and Source Transformation/ Lab Time - varying Signals and Superposition

Part1: Lab Time-Varying Signals

Purpose: This lab aims to give a tutorial pertaining to creating some simple types of waveform generators, using an oscilloscope to measure time varying signals, and analyzing voltage divider.


Pre-Lab:


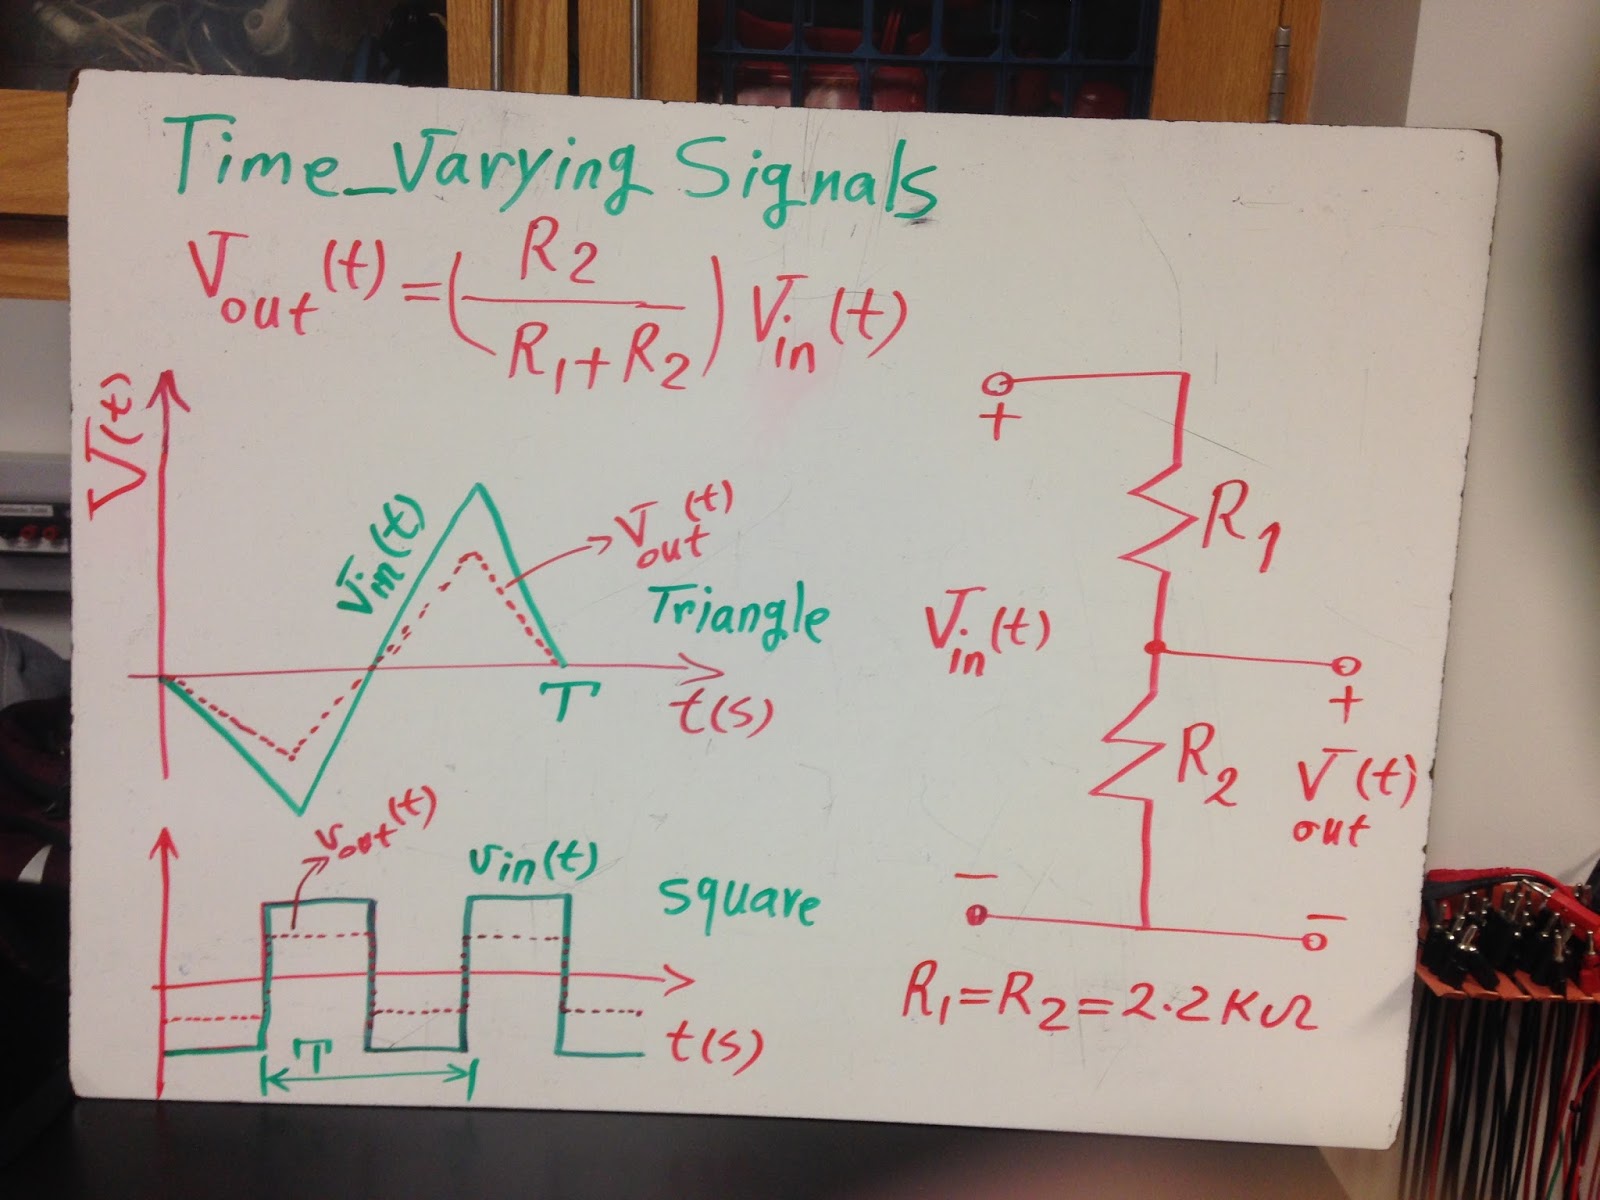
The amplitude and period of both the input and output waveform including a sinusoidal wave, triangular wave, and square wave. 


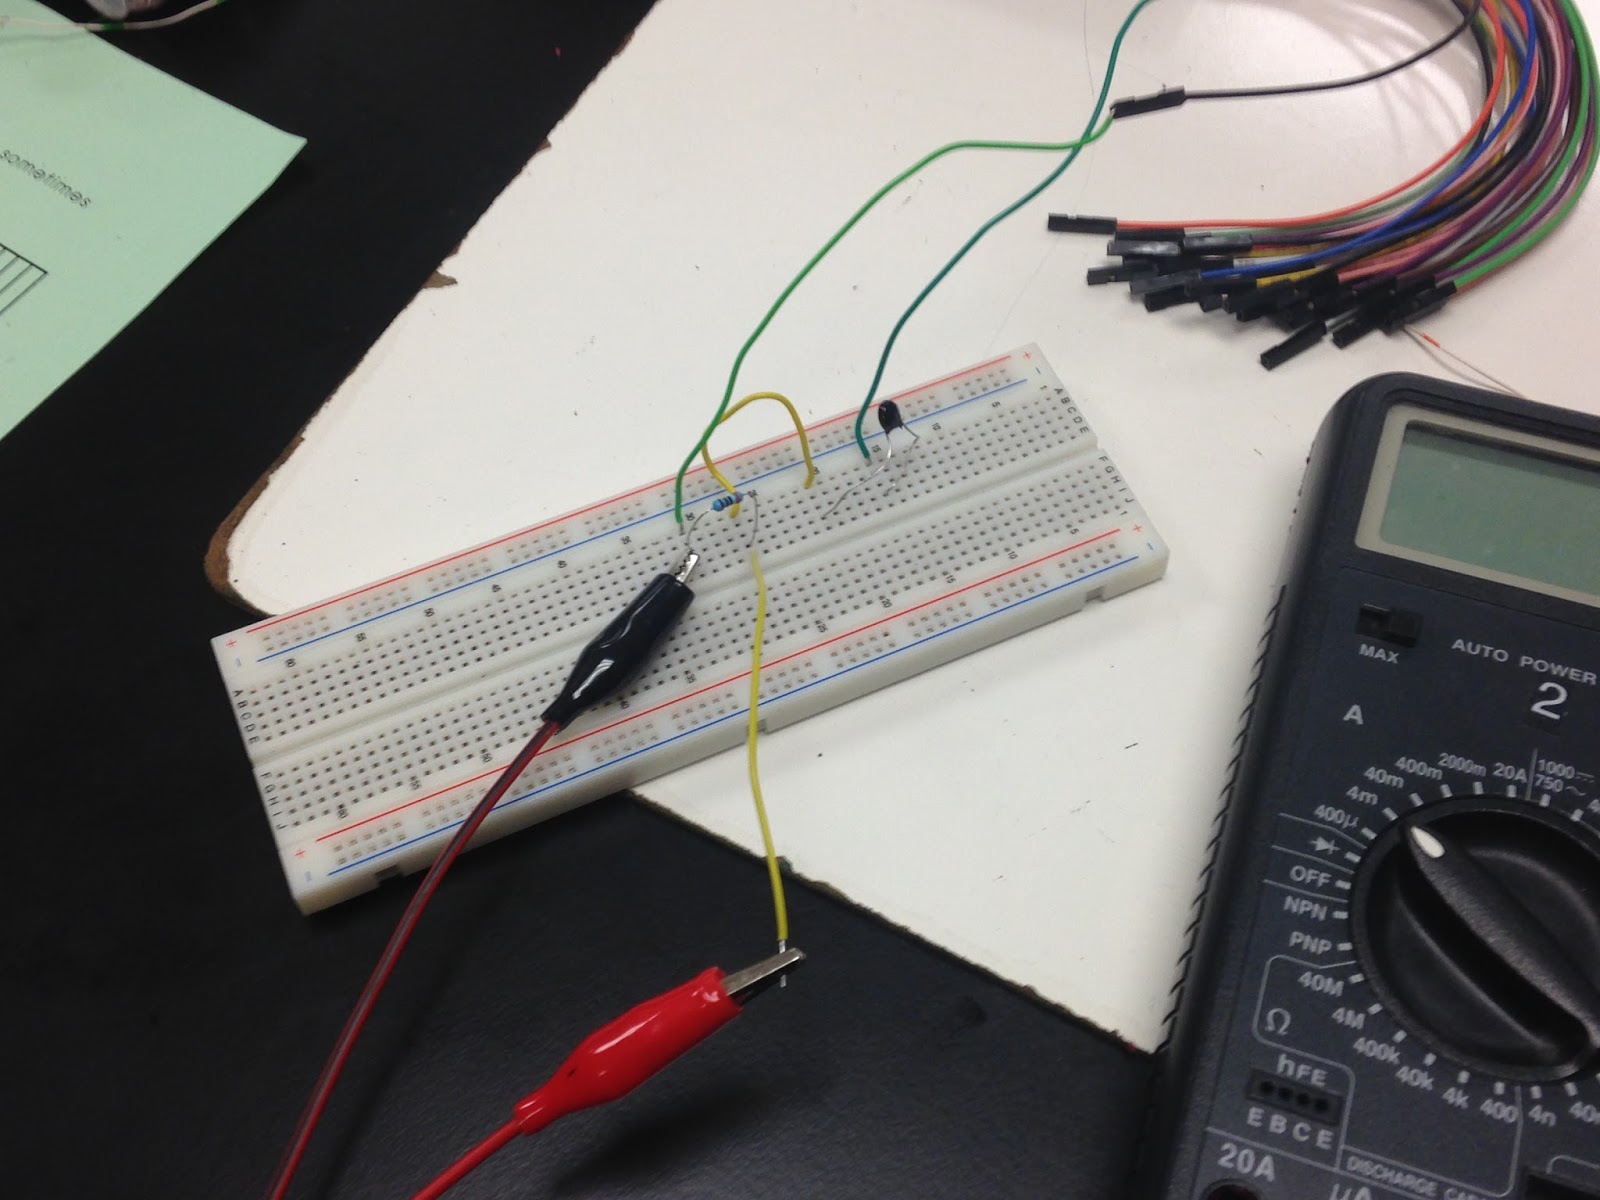
Based on the model of a voltage divider, we set-up the bread-board and analog. After a few adjustment in the waveform generator window, we create the desired type of wave and perform our measurement on the oscilloscope window. 

The sinusoidal wave. The input voltage is the blue curve and the output is the orange curve.
On the oscilloscope (measurement), the Vin (amplitude 2V, frequency 1kHz, period 1ms), the Vout (amplitude 1V, frequency 1kHz, period 1ms). The measurement results match with our expectation. 


The triangular wave. The measurement values are Vin(3V, 1kHz, 1ms), Vout(1.5V, 1kHz, 1ms), which agrees with our expectations. 


The square wave. The measurement values are Vin(2.5V, 500Hz, 2ms), and Vout(1.25V, 500Hz, 2ms), which agree with our expectation. 

Shortly, this lab is designed so that students can follow easily. We have no difficulty to get the desired values. All measurements are the same we expected. 

Part 2: 

Linearity property: A linear circuit is one whose output is linearly related (or directly proportional) to its input.

We are introduced a theory of linearity property, which is one whose output is linearly related/directly proportional to its input. Then we do a problems to verify that. Our group do with the 24V, while others groups do with 12V. Consequently, our results is as twice as other group's results.


Then we study about another technique to analyze a circuit: superposition. It states the voltage across (or current through) an element in a linear circuit is the algebraic sum of the voltages across (or currents through) that element due to each independent source acting alone. We do a practical problem by using superposition. 

Part 3: Superposition Lab

 Purpose: The lab is to verify the superposition technique.

Pre-lab:

We calculate the V using the superposition and get V=2.69V
Procedure


We set up the experiment and get the measured value is 2.74V when 3V source and 5V source are applied


The 3V source is applied alone, and the value is 0.69V. Subsequently, the 5V source is applied alone, and the value is 2.03V

These are our calculated values(in red) and measured values(in green) of the resistors and the desired voltage.
 Shortly, we perform the lab successfully when our calculation meets our measured results. The experiment shows that the superposition is verified.

Part 4: Source Transformation

A source transformation is the process of replacing a voltage source vs in series with a resistor R by a current source is in parallel with a resistor R, or vice versa.
Note: When using source transformation to analysis, we do not transform the branch relating to the unknown value because it will affect the results. The reason is the source transformation is equivalent for the a and b terminal only.


After that, we do a practice problem to enforce our skill. 

Summary

In conclusion, this class we do two experiments and learn two more circuit analyzing techniques which are superposition and source transformation. These techniques are piquantly powerful to simplify a bewildering circuit. However, for the source transformation, we have to carefully transform the circuit so that the answer is not affected. 

Friday, March 11, 2016

Day 5: Notes Nodal and Mesh Analysis/ Nodal Analysis Lab

Professor Mason starts the lecture by introducing a special case about nodal analysis and define the supernode.


The circuit illustrating the supernode, which encloses the voltage source connected two non-reference nodes and any element to connected parallel with it


The practice problem for the supernode analysis. In the picture the supernode is the green circle, which has a voltage source connecting two non-reference nodes.

Nodal Analysis Lab:


We do the pre-lab activity to calculate the V1=-2.36V and V2 =4.36V. 


The actual resistance of the resistors, consecutively, are 22k, 6.7k, 9.89k (unit:  Ohm), and we calculate V1 and V2 from the actual resisances. Then the percent errors %V1= 2.96%, %V2 = 1.6%.


The set-up following the schematic of the circuit. 

The measurement for the currents and voltages.


The records for the currents and voltages measured by DMM, V1=2.41V and V2=4.4V. The bottom of the table is the estimates for the voltage V1=2.43V and V2= 4.43V from the actual resistances. The measured and the expected values of V1 and V2 are slightly different with 0.8% adn 0.7%. Hence, we do the set-up and the lab well with the values of the measured and the expected 

Everycircuit and Mesh analysis:
The next class is about the everycircuit and a new circuit analysis method


The introduction about everycircuit application.


The practice problem for the mesh method.


Check the results by using the everycircuit


Professor introduce the matrix method to solve for unknown variables.


At the of the lecture, the professor review how to read the color code on the resistors.

Summary:
This lecture is about the supernode and mesh analysis, as well as a quick review of reading the resistance of a resistor. Besides, the lab aims to help student verify the nodal analysis method. And we get the measured voltage in the expected results, so we do the experiment effectively.

Saturday, March 5, 2016

DAY 4: Nodal Analysis/ Temperature Measurement System


NODAL ANALYSIS

Today we have a quiz. This is a about solving the voltage drop in the circuit which will be expressed by known elements in the circuit. With the previous KCL and KVL method, the algebra of the quiz is kind of complex. However, this is the good example for the new method that will simplify the algebra of the problem, the nodal analysis. 

TEMPERATURE MEASUREMENT SYSTEM

After the quiz, we perform the Temperature Measurement System lab. The professor Mason begin the lab with the hook about the technology in a 3-D printer. This technology is the application of the resistance change in respect to the temperature. 


The explanation about the rate change of  voltage (V/bit). 

The expression for the rate change of temperature ( Celsius degree/bit)


The analyze the circuit to determine v(out) as a function fo R(th) and R. From the equation on the whiteboard verify that v(out) increases as temperature increases. Based on the given graph resistance vs. temperature, we get the termperatur at 25 Celsius degree adn 37 Celsius degree. According to our analysis, we find that R = 4k Ohm and R= 18k Ohm will satisfy the requirment( which we change to  0.4 V voltage change to get the valid R). 


The set-up for this lab based on the diagram. 


The record of resistance at the room temperature (25 C) and at firmly holding (33C). R(th 33C) = 7.3 Ohm and R(th 25C) = 10.95. the record of the voltage response to the specified temperature change. As the results showing, the circuit's performance is almost the same as the design specification with 0.53V voltage change. The percent error is 32.5%,  


The video demonstrating the operation of our set-up


Post-lab activity: The value of R that make delta V maximum is R= square root (R(th1) * R(th2)).


After the experiment, we study about the nodal analysis. This method helps to simplify the equation in the questions like the quiz. We do a nodal analysis problem to practice this method

Summary:

The most important things we learn today are the nodal analysis method and the practical problem in the "temperature measurement system" lab. With the nodal analysis, we can approach to the particular circuit problem more easily. Besides, The lab activities help us improve our intuitiveness and thinking relating to the engineering problems.

Wednesday, March 2, 2016

Day 3 Series and Parallel/ Dusk-to-Dawn Light


Series and Parallel

In the early class, we have the conversation with a graduate student on computer engineering about engineering career and experience.


The class lecture begins with the prediction of the hot dog attaching a line cord.

As our group predict, the hot dog is slowly cooked.


Then the professor attach some LED's on the hot dog: few parallel, few perpendicular. And let us predict what will happen. 


As we predict with the parallel attachment the LED will light up, while the perpendicular one will stay off. The voltage change will create the current, and the LED will light on. In the perpendicular connection, there is no voltage drop, so the light is off.


Then we come with the example to measure the voltage in a circuit. In addition, I understand more a about the voltage and current sources' symbols in the circuit, as well as the independent and dependent labels. 


Then we come up with another problem to use the KCL, KVL in order to find the unknown current and voltage


The professor show us another way to solve for the problem. This is more convenient in solving the problem if you choose right node to form the equations.


We learn about voltage divide and its formula. We also learn that the resistor that connect to the negative/ground of the source will be the v(out) in a voltage divider circuit.


Here is many types of resistors that we need to concern when establishing a circuit. As a engineer, we need to concern about how to bring the theoretical problem to the real world.


This is one of the possible situations that satisfies the requirement of the circuit with the use of two obtainable resistors.


We find the resistance of the above circuit.


We solve for an equivalent resistance problem.


DUSK-TO-DAWN LIGHT

We study the fundamentals about the diodes and LEDs, Bipolar Junction Transistors BJTs, and the photocell.


Before the lab, we do some calculation in order to predict what will happen in the lab. As we calculate, the Vb for photocell is 1.65V for 5k Ohm and 4.8V for 20k Ohm. 
Then, we set up the circuit based on the diagram. Tips: 1. diodes only let current passing in one direction, so the anode (longer pin) have to be connected to the positive side.


The set-up of the experiment.


The video with the result of the lighting-on LED.


The record of the Vb when the LED on and off. When the LED is on, Vd(diodes)=2.1V and Vb=2.79V. When the LED is off, Vd=0.15V and Vb=0.452V. The record is really off from our calculation, so we measure the resistance of the photocell directly from DMM. R(off) = 1.6k Ohm, and R(on)=20k Ohm. They are much different from our given values for calculation. With new values we calculate Vb(off)= 0.689V which is 34% different from the measured value , and Vb(on)=3.3V which is 15.5% different form the measured value.

Conclusion: 

Today we learn about the voltage divider and current divider with some practice problems, and perform the lab on the BJT current controlled current source with the photocell that can change its resistance according to the light intensity applied to the sensor. And we did the lab successfully as the above video addresses.